Plot
Plotting in the Julia language.
PlotlyLight.jl
I really had to write about the PlotlyLight package because it starts up much faster than other plotting packages, both in terms of first run time and first plot time. So how fast is it?
1
2
3
4
5
6
7
8
9
@time import Plots # 1.757127 seconds
@time Plots.plotlyjs() # 17.849170 seconds
@time Plots.plot(1:20, 1:20, type="scatter") # 3.281065 seconds

@time import PlotlyJS # 1.746334 seconds
@time trace1 = PlotlyJS.Plot(PlotlyJS.scatter(x=1:20, y=1:20, mode="markers")) # 1.760041 seconds

@time using PlotlyLight # 0.114527
@time p1 = plot.scatter(x=1:10, y=rand(10), mode="lines+markers"); # 0.101052 seconds
To get started, You can directly copy and modify the template below, which already includes most of the commonly used options.
1
2
3
4
5
6
7
8
9
10
11
12
13
14
15
16
17
18
19
20
21
22
23
24
25
26
27
28
29
30
31
32
function set_PlotlyLight_template(; theme::Symbol=:light)
    template = Config(
        font=Config(family="Arial", size=16, color=theme == :light ? "black" : "#dbdbdb"),
        plot_bgcolor=theme == :light ? "white" : "rgba(0,0,0,0)",
        paper_bgcolor=theme == :light ? "white" : "rgba(0,0,0,0)",
        margin=(l=60, r=15, t=10, b=60, pad=0),
        xaxis=Config(
            showline  = true,
            linecolor = theme == :light ? "black" : "#dbdbdb",
            linewidth = 1.5,
            mirror    = true, # Mirror image has axes on all four sides
            ticks     = "inside", # Orientation of the ticks
            title     = Config(standoff=1),
            gridcolor = theme == :light ? "rgba(0,0,0,0.1)" : "rgba(255,255,255,0.2)",
            zeroline  = false
            # titlefont  = template.font,
            # domain    = (0, 0.6), # 60% of width in x-direction
        ),
        legend=Config(
            bgcolor = theme == :light ? "white" : "rgba(0,0,0,0.5)",
            x       = 0.01, # Relative position of the horizontal to the anchor point
            y       = 0.99 # Relative position of the vertical pair of anchors
            # xanchor     = "right", # Anchor x-axis alignment datum ("left", "center", "right")
            # yanchor     = "top",   # Anchor y-axis alignment datum ("top", "middle", "bottom")
            # borderwidth = 0,
        )
    )
    template.yaxis = template.xaxis
    return template
end
PlotlyLight.settings.layout.template.layout = set_PlotlyLight_template()
# equivalent to `PlotlyLight.settings.layout.template = Config(layout=my_template)`
Let’s plot a figure to see this.
1
2
3
4
5
6
7
8
using PlotlyLight
p1 = plot.scatter(x=1:10, y=rand(10), mode="lines+markers", layout=set_PlotlyLight_template())
# The above can be simplified as
p1 = plot(x=1:10, y=rand(10))
# Now we save it
using PlotlyKaleido
PlotlyKaleido.start()
savefig(p1, "myplot.png") # .svg
Plots.jl
Plots is a visualization interface and toolset. It sits above other backends, like GR, PythonPlot, PGFPlotsX, or Plotly, connecting commands with implementation. If one backend does not support your desired features or make the right trade-offs, you can just switch to another backend with one command. No need to change your code. No need to learn a new syntax. Plots might be the last plotting package you ever learn.
1
2
3
4
5
6
7
8
9
10
11
12
13
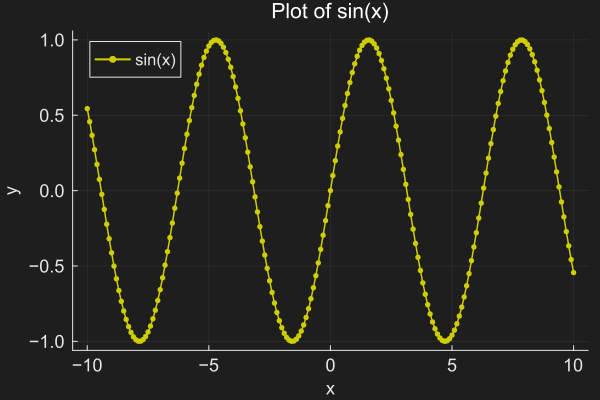
fig = plot(-10:0.1:10, sin.(-10:0.1:10),
bg_color=RGB(0.12),
label="sin(x)",
linewidth=1.5,
linecolor=:yellow3,
marker=:circle,
markersize=3,
markercolor=:yellow3,
markerstrokewidth=0,
title="Plot of sin(x)",
xlabel="x",
ylabel="y")
savefig(fig, "sin.png")
It can be very annoying to enter so many parameters every time you plot, so Plots provides a default parameter function. You can set the global default parameters via default().
1
2
3
4
5
6
7
8
9
10
11
12
13
14
15
default(fontfamily="arial",
    bg_color=:transparent,
    framestyle=:box,
    tick_direction=:none,
    linewidth=1.5,
    tickfont=(12, RGB(0)), # RGB(0)=:black
    guidefont=(12, RGB(0)),
    fg_color_axis=RGB(0),
    fg_color_border=RGB(0),
    fg_color_grid=RGB(0.82),
    markersize=3,
    markerstrokewidth=0,
    legendfontsize=11,
    legendfontcolor=RGB(0),
    legend_foreground_color=RGB(0))
To add a plot to the current figure, use the ! version of the function, e.g. plot!(). To draw on a specified figure, use fig as the first argument: plot(fig, ...).
CairoMakie.jl
CairoMakie is suitable for drawing two-dimensional, static images. It offers many parameters for detailed customization. We can write a function to wrap commonly used settings.
1
2
3
4
5
6
7
8
9
10
11
12
13
14
15
16
17
18
19
"""
    cairomakie_plot(x, y; lable=nothing, yscale0=identity)
`yscale0`: identity, log10
"""
function cairomakie_plot(x, y; lable=nothing, yscale0=identity)
    with_theme(theme_dark()) do
        fig = Figure(fontsize=14, size=(700, 400))
        xrange = (minimum(x), maximum(x))
        ax = Axis(fig[1, 1],
            xlabel="x", xtickalign=1, xgridvisible=false, # xticklabelsize=14
            ylabel="y", ytickalign=1, yscale=yscale0,
            limits=(xrange, nothing))
        lines!(ax, x, y, linewidth=2, linestyle=:solid, color=:tomato, label=lable)
        scatter!(ax, x, y, marker=:circle, color=:tomato)
        axislegend(ax, labelsize=15) # position=:lb
        display(fig)
        # save("my_first_figure.svg", fig)
    end
end
The syntax of with_theme() do ... allows a one-time application of theme styles. The default style is restored on the next plotting.
To permanently change the drawing theme, one can use set_theme!(merge(theme_dark(), theme_latexfonts())).
Example
Let’s draw a sine function and save it as a vector graph:
1
2
3
4
5
using CairoMakie
f(x) = sin(x)
x = -10:0.1:10
y = f.(x)
cairomakie_plot(x, y)
